Tag Archives: social media

Target Kaleidoscopic Spectacular: when good campaigns go bad.

18 Aug

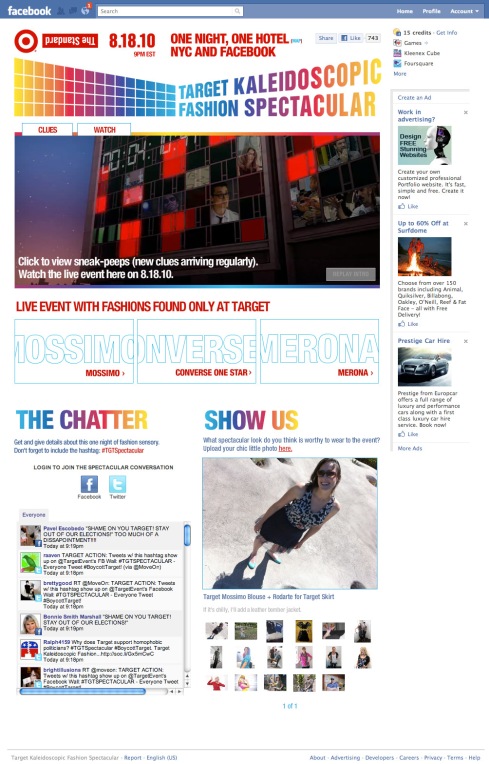
Shared real world experience – check. Live video – check. Facebook & Social media integration – check. Teaser buzz campaign – check. $150,000 donation to anti-gay governorship candidate – ahhh bugger.

The Target: Kaleidoscopic Fashion Spectacular in New York City at the Standard Hotel, sees Mother N.Y. and Target debuting a massive indoor/outdoor spectacular to promote the store’s fall line of clothing. The event is shared through Ustream video on a Facebook page and pulls together people’s responses and coverage using the hashtag #TGTSpectacular and OpenGraph.

It is a really nice campaign, another example of what I think is the future of Brand Reality Creative: work that combines utility and brand story in a way that effects the real world.

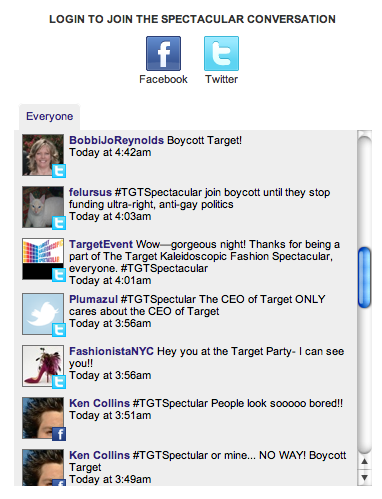
Unfortunately the “community’s shared responses” all over the Facebook page and wider web have nothing to do with the campaign and everything to do with the Target’s donation to Minnesota Forward, a republican group in Target’s home-state of Minnesota, which is a lot less equal rights focused than Target itself.

The campaign has now become a channel for debate and outrage with people a lot less interested in the spectacular 20-minute performance accompanied by an original soundtrack by Squeak E. Clean, aka Sam Spiegel, performed by a 30-piece orchestra and 10-person chorus.

Transparency and consistency online is vital. If your brand and your deeds diverge you will be found out and called out.

Unfortunately for Target and Mother NY this has happened in a big way – just showing that for real people there are a lot more important things than advertising.

Facebook Myths busted

13 Jul

A nice piece of work from Soap Creative in Australia (same guys behind BannerBlog.com.au). Now if we can find a cure for Facebook/Twitter tourettes at the same time that would be nice.

Social Media and the challenge of giving credit for the sale (Return on Social Spend?)

28 Apr

“Where’s the ROI in social media?” It’s an old question asked again and again, when often the question really being asked is “Where’s the Return on Advertising Spend?”

We’ve found that you can actually use successful Journey Analysis case studies from eCommerce or digital direct comms to sell the benefits and “Return on Social Spend” of social activity to more traditional “hard metric” clients.

Journey analysis can allow subsequent sales to be attributed up to 10 clicks earlier on in the customer journey, which enables you to understand search activity value.

Conventional wisdom says you don’t spend vast sums on generic or lateral research search terms – they never convert effectively. However, that’s only if you just look at the last click. Journey Analysis can identify specific non-brand or product research terms that feature further back in the customer journey, and it turns out they’re often highly (and measurably) influential. Basing keyword investment on this insight, one project delivered sales up 122%, spend up just 42%. Over a marked and measurable period of time.

Essentially, help people when they’re researching and evaluating, before they’re ready to purchase, and you get a positive outcome when they do get closer to buy.

This kind of “harder” traditional Return on Advertising Spend (ROAS) proof within such a widely accepted channels like search and eCommerce has enabled us to demonstrate an insight that is highly applicable to social media. Today social streams frequently provide peer-endorsed opportunities to discover products/services or the engaging content around them, even though at the time people don’t jump away from what they were doing and buy. Later, an ad delivered by the search or display channel can stimulate the final sale. Journey analysis helps us map these interactions.

In turn this helps to get CFO buy in – it not only makes sense but has numbers to back it up – so that we can develop social activity and campaigns focused around stimulating research activity in the Exposure and Engagement categories of online relationships documented here.

Social Marketing, Listening and Engagement

22 Apr

Implementing Social Marketing for business and communication, a remix of some previous ideas and some new approaches.

2010 Digital Trends, Ideas and Technologies (Part 1)

5 Jan

Here is Part 1 (of 2, maybe 2 and a half) of our 2010 Digital Trends, Ideas and Technologies presentation that I finished off over Christmas. It’s based around 4 Themes, which are each broken into 2 areas of focus/exploration:

It is in Beta (or that’s my excuse for a couple of gaps) and draws on a lot of ideas from some interesting people who make the strategy and digital creative world a good place . I’ll be posting the full list of sources here but in the meantime any feedback, ideas or input is gratefully accepted.

————————

Update: The presentation has now been voted onto the homepage and then chosen as a Top Presentation of the Day of Slideshare.net and picked for the homepage of noteandpoint.com. Thank you very much.

Social Media monitoring and the spectrum of online relationships

1 Oct

I got talking to the COI the other day about online PR, Word of Mouth and Social Media and the conversation turned to the problems of ROI and monitoring.

I’ve sat in too many Social Media presentations that promise a bit about ROI at the end but instead of a practical approach just mention “the power of conversations”, list a few free tools and then mention one of the larger monitoring services.

Unfortunately despite people intuitively knowing that the social and consumer-centric business approach is the future for marketing and communications, this won’t convince a CFO or the global board. They like models and numbers.

So off the back of this I took an earlier post based on some of Mike Arauz’s thinking and started to try and categorise the numerous, different monitoring techniques out there to make comparing like with like more possible.

Anyway here goes…

An approach to Social Media Monitoring and measurement based on the spectrum of online relationships

Increasingly the value of an idea is not in its initial direct exposure, blog mention or spot/insertion in a publication, but in the value or social currency it provides to the audience. This social oxygen value enables the idea to spread socially.

Social Media campaigns are uniquely measurable but not all measures are equal and indicate true effectiveness. Different social media actions or online conversations have different values and influences upon consumer behaviour.

Multiple metrics, from number of followers and fans, to positive or negative sentiment, to reposts and influencer mentions, can be difficult to distinguish from one another. In effect we can become trapped in a state of analysis paralysis where there is too much social media data and too little understanding.

An agreed industry standard is needed but, until a consensus arises, we have developed a structure to categorise the value of different monitoring tools/metrics and start building an measurement and tracking model.

Fig. 1

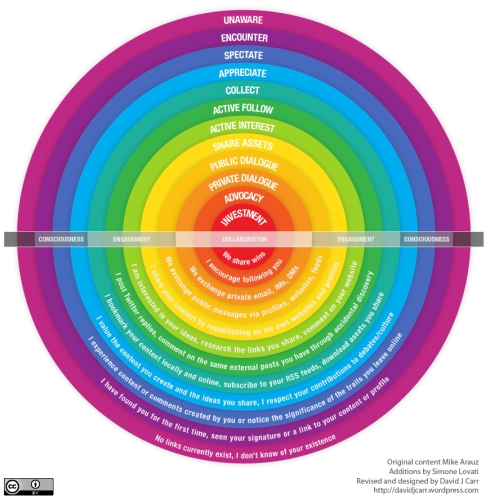
fig. 1 – Spectrum of Online Relationships

By classifying social media conversations into three categories – Exposure, Engagement, Collaboration – based on the Spectrum of Online Relationships that underpin them (fig 1), we can group their associated metrics and monitoring approaches (fig 2). Then by examining the overall performance of the activity in each category we can begin to establish the effectiveness and conversion rate of social media campaigns and ongoing activity.

The idea is to simplify all the different effectiveness measures out there so comparisons/trends can be made and then these can then used alongside true Social ROI calculations.

Fig. 2 - Social Media ROI Metrics and Measurement Techniques

fig. 2 - Social Media Monitoring, Metrics and measurement tools by category

Categorising social media activity this way means it is possible to take a holistic approach and use aggregates of the different monitoring techniques – and metrics that will vary according to the nature of every campaign and its platform type – to compare the performance between each category and hence work out the relative success of the social media activity. The ultimate goal of this approach is to be able to compare the effectiveness of different social media campaigns when comparing like with like is often difficult.

Using this structure means that the results of the Exposure, Engagement and Collaboration categories can be compared to identify performance and trends.

I’ve arrange an example of this way of thinking as an equation (which is sure to attract the wrath of Anna O’Brien who rightly points out the falseness of the different social media “ROI metrics” and silly equations out there) but it is not meant to be a magic bullet or mathematically sound – it is a visual way of structuring thinking about the principles at play.

For example, one measure of a social media campaign’s momentum – Social Media Traction – would be to compare the ratio of Engagement performance to Exposure performance (Fig 3) where a +1 would indicate success and social media momentum as people moved from being merely exposed to a campaign to becoming more engaged.

Any measure/inputs of Exposure or Engagement (or even Collaboration) would differ for each campaign and organisation – as I said earlier the idea is to simplify the different effectiveness measures and monitoring techniques so comparisons can be made and trends identified.

fig. 3 – A way of thinking about a campaign’s traction by comparing performance in the Exposure and Engagement categories

fig. 3 – A way of thinking about a campaign’s traction by comparing performance in the Exposure and Engagement categories

Equally using this approach to define Social Media Conversion and Advocacy would require a focus on activity and metrics within the Collaboration category. Indeed, the ratio between Engagement performance and Collaboration performance could be seen as being an indicator of people moving from discovering, sharing and “playing” with content to acting upon it – whether making it their own passion or hopefully even changing purchasing behaviour.

Ultimately this proposed approach to Social Media monitoring/measurement will need to be linked back to ROI. Can we prove whether good results in either category – or a good Social Media Traction or  Social Media Conversion and Advocacy score – can relate to a lower Cost per Acquisition or an increase sales?

This will require someone much better at maths than me but I believe that some agreed structure and model is vital to proving the long term value of social media and the real web to the board and CFO.

Spectrum of online relationships diagram

8 Sep


Spectrum of Online-based Relationships

Spectrum of Online-based Relationships

Back in April Mike Arauz published his excellent Spectrum of Online Friendship that I’ve since been using to describe some of the strong and weak bonds that exist between people in the real web versus the marketing web. 

However, I started overlaying some additional information such as the volume of relationship types, weaker connections that exist before both parties are mutually aware of each other and even the general timeline phases of the relationships*. And I was doing it in Powerpoint and Keynote. And it was ugly and confusing. So I got Illustrator out to do one of my diagrams.

And this is the result. Hopefully you like it and can use it.

The thinking credits go mostly to Mr Arauz and also to Simone Lovati who suggested some additions in the comments on Mike’s original post (who says comments are full of Spam and poor spellers).

I just added a bit, rearranged some flows and made it look (hopefully) pretty.

*Just to note, these are relationships that begin online as opposed to through physical, traditional friendships or acquaintance.

——–Update———

I’ve built on this now to explore how we can measure activity within the different categories of activity

Social Media monitoring and the spectrum of online relationships


Social media campaign diagram

12 Aug

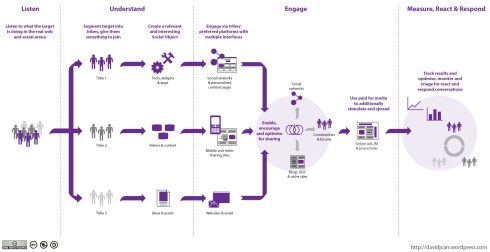
I’ve been working on a series of social media/earned media/real world web campaign strategies recently and thought I’d take a load of different diagrams and best practice approach slides and combine them into one social media campaign overview diagram.

Anyway, in the spirit of sharing here it is. If you’ve any ideas about bits I’ve missed let me know in the comments so I can tweak it.

social_strategy_diagram

What are real people doing in the digital world? (2009 Trends)

26 Mar

Real people’s identities are currently scattered across services, sites and functions on the internet. As new tools, trends and fads have developed, so have the multitude of places where elements of our identity can be accessed. We have become the comments we have made, the transactions we have completed, and the user accounts we have collected or even forgotten that we had. As UnHub, a consumer service inspired by the Skittles campaign, puts it: You are Everywhere.

This fragmented reality does not mean we should all boldly delete our brand- or comms-led websites and march off to join the latest platform: a Facebook presence does not equal “getting it”.

Lets face it, marketers love Facebook. People just use it.facebook_slides11

Social Networking is invisible as a concept. It is a pervasive tool. Just like there is no “new media” anymore, Social Networking or “Earned Media” shouldn’t be seen as a distinct category. It is just interactive but it is people’s space. The recent redesign of Facebook alone proves that people feel they own it and that things in their space should not be interfered with.

What this fragmentation means is that we need to increasingly focus our thinking on how real people are connected – with each other and their own, different online identities – and what they are doing. In fact we need to consider not just pure digital connections but connections via social objects that are increasingly digitally enabled. This is especially true of younger people. They are more connected than any of us and point a way to how future behaviour will change for the majority/mainstream.

Young people’s behaviour in a digitally enabled world is proof of the outmoded nature of the old “six degrees of separation” cliché. One of the best recent illustrations of the complex, non-linear connectivity of real people is the SharedEgg data visualisation.

“SharedEgg is a diagram of subcultures based on data collected from the people who make up those cultures. People categorize themselves using their objects and through their categorization are linked to the other people participating in the project. What has resulted is a deeply complex image showing social trends and unknown bonds between people through those trends.”

2344163441_e1f8e769e3_b-1

While SharedEgg has revealed an ever increasing number of “unknown bonds” created by shared activities, points of reference, trends and communication tools, two questions remain: (1) what are people doing to create these bonds; and (2) how can we as creative communicators get involved when these bonds are stronger and more complex that any linear traditional campaign?

The Digital Youth Project (University of Southern California and University of California, Berkeley) provides a good insight to the “What are they doing” question.

“The digital world is creating new opportunities for youth to grapple with social norms, explore interests, develop technical skills, and experiment with new forms of self-expression. These activities have captured teens’ attention because they provide avenues for extending social worlds, self-directed learning, and independence.”

Living and Learning with New Media: Summary of Findings from the Digital Youth Project

The project reveals a Maslow hierarchy of needs for the digital age.

digital_youth

At its most basic the internet is being used to uplift mood and give people something (and a somehow) to talk about. It is about social oxygen. However, as we get higher up the hierarchy the level of engagement and the level of “digital proficiency” increases. People start making themselves and things.

What can we, as marketers and creatives, do in response to this reality?

Traditionally there are two worlds of thought about interactive creative, two almost polarized camps: those who believe that the answers are Communication & Content, and those who believe the answers are Utility & Context.

worlds_of_thought

But the reality is not black or white, it falls between the two camps. The reality is work that aims to be “good enough to share“.

Next >> Good enough to share: designing creative with nodal points in mind

This is part of “The Changing Nature of Interactive Creative” whitepaper.